Remember the MTV show Pimp My Ride? It started in 2004 and was hosted by Xzibit. The premise was a car that was in rough shape was restored and customized according to the owner’s tastes and hobbies.
However, the show focused only on the car’s cosmetic defects. Several owners later came out and said the show did nothing to fix the running condition of their cars. Others even had to get thousands of dollars of engine work to get their tricked-out cars to even run after appearing on the show!
Measuring keyword performance
A year after Pimp My Ride premiered, Google Ads introduced its Quality Score. Google Quality Score is a metric for how relevant a keyword is to a user’s search based on thousands of signals from past ad auctions.
Scored from 1 to 10, the idea is that the higher your ad’s Quality Score, the better the performance from that keyword and the more likely your ad will show and get clicked by the user.
For years, Quality Score has been an influential metric in the Google Ads world. Some advertisers prioritize raising their Quality Scores over any other optimizations.
But according to our data, Google Quality Score is not a true indicator of actual keyword performance.
To us, Google Quality Score is exactly like Pimp My Ride.
Yes, Quality Score is a great vanity metric that can indicate that the overall account is healthy. Yes, the exteriors of the cars on Pimp My Ride looked cool (for the time!)
But the show ignored the actual performance of the car. Just because it looks pretty on the outside doesn’t mean that what’s under the hood is running properly.
How a Quality Score is determined
What exactly goes into a Quality Score? According to Google, three variables are used to calculate the quality score of a keyword:
- Expected click-through rate (CTR), or how likely an ad will be clicked by a user;
- Ad relevance, or how well an ad answers the intent of a user’s search;
- Landing page experience, or how relevant the landing page is to the user.
At a high level, it sounds like Google Quality Score should be the perfect metric. It takes these major factors into account as to whether or not a user will ultimately turn into a lead or sale.
But there are several issues with using Google Quality Score as a predictive metric. For starters, it is just that: a prediction. It isn’t a real world measure of your keyword’s performance (more on this later.)
Myths about Google Quality Score
Even Google acknowledges the pitfalls of focusing solely on Quality Score. According to Google, its Quality Score “is not a key performance indicator and should not be optimized or aggregated with the rest of your data,” indicating that Google is reluctant to recommend focusing on Quality Score as a performance metric.
More than a little suspect for a metric that some advertisers tout as their secret sauce!
For advertisers who rely on YouTube and display ads, you’re out of luck as Quality Score is only featured on search ads. (That is, if Quality Score were truly the most important metric. If it were, why wouldn’t Google feature it on display or YouTube where engaging ads are arguably more important than search ads?)
Excluding YouTube and display ads from Google Quality Score feels like a missed opportunity, especially when the audience for these ad types is colder than on search.
Another huge myth about Quality Score is that it factors into the ad auction. This is FALSE. I’ve heard several advertisers say that a high quality score can make your ads cheaper, and this is simply not true. Quality Score is only an anticipated outcome, not the actual outcome. And it is not an input in the ad auction.
Finally, our data tells us that Quality Score is not a good indicator of real-world performance.
What the data shows us about Quality Score
Take a look at these metrics from one of our clients:
Several things stand out here. The elephant in the room is that no Quality Score for these keywords is over 5, with one as low as 3! Our best-converting keyword is sitting at a 5 Quality Score with a below-average expected clickthrough rate. But as the actual metrics show, a 9.9% click-through rate isn’t exactly below average.
Another interesting wrinkle is that our lowest Quality Score keyword also happens to be our lowest cost per conversion in the group. This client’s conversion rate has improved by over 50% compared to their previous paid media partner. The client’s overall lead volume also increased.
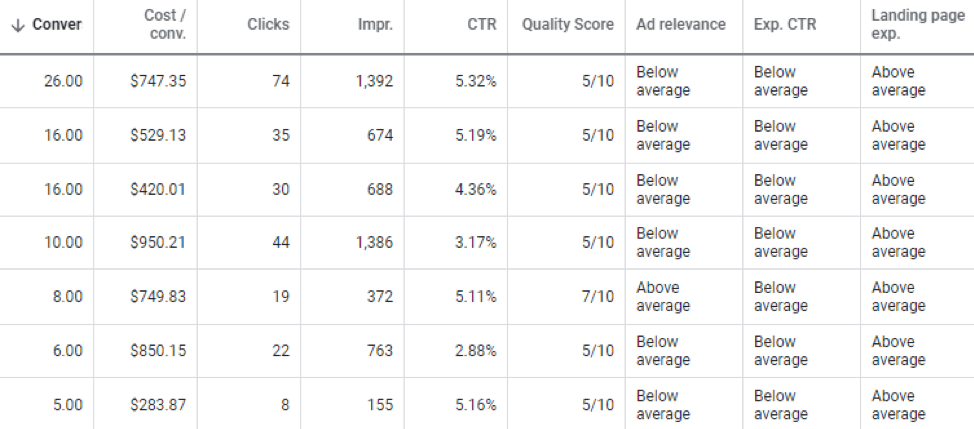
Here’s another example from a different client:
This time, we have mostly 5s across the board, with one 7 for good measure. Our highest-volume keywords are sitting at a 5 Quality Score but all have click-through rates over 4. One is as high as 5.32%, above industry standard for this client’s vertical.
What else stands out here is that our 7 has the third-highest cost per conversion of the bunch. Our cost per conversion has gone down for this client and our cost per sign-up is 30% lower than their previous vendor.
So what does Hennessey Digital advise our clients when it comes to Quality Score?
Our Paid Media team’s recommendation
For pay-per-click campaign success, we ensure that keywords are relevant, the ads are compelling and answer the query of the user, and the landing page is easy to navigate and designed with the conversion in mind.
Our team has observed disconnects between Google Quality Score and actual keyword performance. Because of this, we’ve shifted away from using it as a key metric.
Rather than focus on Quality Score, we pursue the outcome that matters most to our clients: leads. At a basic level, the metrics that matter most are the same metrics we emphasize: conversion rate, click-through rate, etc.
To conclude, Google Quality Score isn’t what it’s cracked up to be. I know I’d rather have a well-running Toyota Camry than a Lamborghini with an engine that won’t start.
(And you probably shouldn’t hire Xzibit to run your Google Ads.)


